Introduction
Project statement
The project is to make a network of nodes to capture data, relay that data to a web application, and display that data to the user. In the current market, an agronomist can buy a single sensor to monitor temperature, soil moisture and other data for nearly $2,500 along with a $500 annual operational fee. This team’s solution is to develop a system that will have network of nodes that can measure this data at an affordable price. The system is made up of several operational nodes that collect the data, using some abstract sensor, and pass the information along to a single home node. The home node is capable of using a wireless cellular network, and can compile the data from all the operational nodes and send this data to a web application, where it can be viewed and interpreted by users. Each of the nodes is designed to last up to 7 months on a battery pack while being cheap and disposable so they can be easily replaced.
Scope
This project could benefit farmers; this is the target case in mind that the system is designed for. These cheap, wireless nodes will be able to send data about the moisture in the soil, temperature, and other desirable data. With this information, the farmer will know which areas of their farm need to be irrigated or why crops may be performing better in some areas rather than others. Other potential applications of the project include being used in military settings or measuring erosion of a hill over time.
Goals
The team is divided into three sub-groups for this project based on each individual’s skills. The Web Application team will be led by Ian Harris and Gregory Steenhagen. The Operational Nodes team will be led by Tim Lindquist and Steven Warren. The Home Node will be led by Terver Ubwa and Khoi Cao. The goal of the project is to create network of nodes that can relay sensor data. These nodes will be able to send the data no matter the geographical configuration of the sensors as long as they are within transmitting/receiving distance of each other. These nodes can be in a straight line or clustered together. These nodes will be wirelessly sending the information via radio transceivers and will then be sent up to the cloud through a home node with cellular capabilities. A website will then display this information for the user in an informative and simple interface.
The Team:


|
Ian
|
Charlie
|
Khoi
|


|
Steve
|
Terver
|
Tim
|
Deliverables
The team successfully delivered the three parts of the project that were specified above. The implementation includes several operational node prototypes that have expansion slots that compatible sensors may be attached to. The operational nodes are disposable, with a price point of under $15 per node. This allows the system to be easily scalable to integrate both larger and smaller networks. This is also a competitive price in the market and allows this product to be marketable. Additionally, a prototype exists of a home node that has cellular capabilities that can transfer information via REST endpoints. Finally, Sensor Web is a functioning web application that can store this data and display it to the user in a concise and easily interpretable way.
The team successfully delivered the three parts of the project that were specified above. The implementation includes several operational node prototypes that have expansion slots that compatible sensors may be attached to. The operational nodes are disposable, with a price point of under $15 per node. This allows the system to be easily scalable to integrate both larger and smaller networks. This is also a competitive price in the market and allows this product to be marketable. Additionally, a prototype exists of a home node that has cellular capabilities that can transfer information via REST endpoints. Finally, Sensor Web is a functioning web application that can store this data and display it to the user in a concise and easily interpretable way.
Design
The team broke the project down into three parts. The first are the operational nodes, the second is the home node, and the final part is the web application. The overall system design can be seen in the flowchart in Figure 1.
The team broke the project down into three parts. The first are the operational nodes, the second is the home node, and the final part is the web application. The overall system design can be seen in the flowchart in Figure 1.
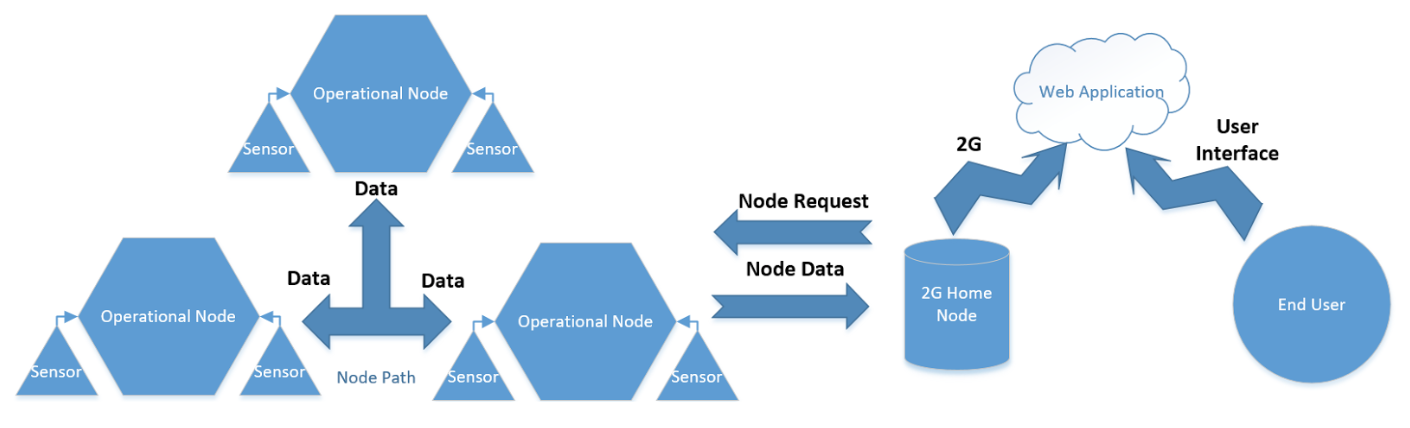
Figure 1: Overall Design
Operational Node Design
The design goal of the operational nodes is to have a low power and low cost module that is equipped with exchangeable sensors for metrics such as temperature, pressure and moisture. The data is read from these peripherals and transmitted to the home node through the node network each day at a specified time. When the system is not transmitting it is in a sleep mode until it is called upon by the home node in order to conserve power. A simple example of a node network is shown in Figure 2.
The design goal of the operational nodes is to have a low power and low cost module that is equipped with exchangeable sensors for metrics such as temperature, pressure and moisture. The data is read from these peripherals and transmitted to the home node through the node network each day at a specified time. When the system is not transmitting it is in a sleep mode until it is called upon by the home node in order to conserve power. A simple example of a node network is shown in Figure 2.
|
Network Protocol
The operational node protocol is defined as follows. The operational nodes operate by all being given a unique ID. When the home node requests data it will send out a struct that contains the ID, sensor data, path, place in path, command and return flag. The ID represents the node the system wants to get data from. Sensor data is the measurement taken by the operational node prior to the request. The path defines a single route through the node network the system will take to reach the desired operational node. Return flag is a boolean which determines if the call is going out (1) to a node or if data is being sent back (0) to the home node. The place in path is a integer which defines where the protocol is in the path (which node it is currently searching for). The place in path will be incremented or decremented based on whether the return flag is 0 or 1. Lastly, command is used for special circumstances such as sleep mode. |
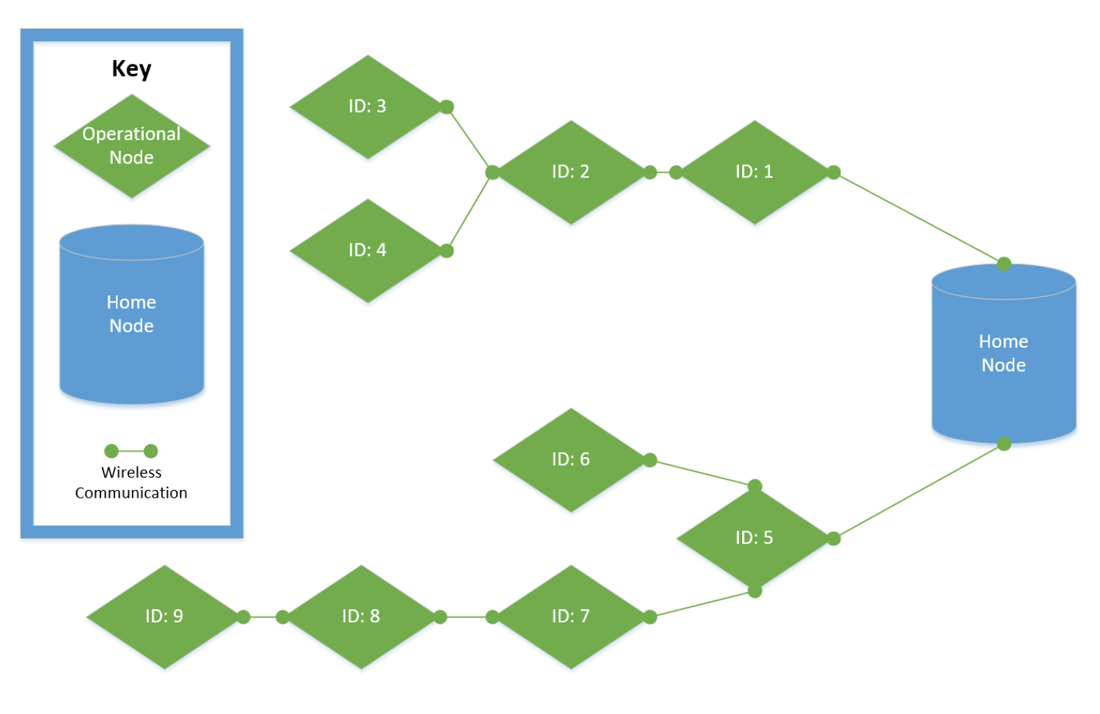
Figure 2: Operational Node Network
|
|
|
|
The order of the paths is handed to the operational nodes. This results in the furthest node on a path will be called first, and the closest and shortest path operational node, will be called last. All of the nodes will listen and if the place in path corresponds to their unique ID, they will either forward the data to the next spot on the path or if it is at the end of the path, the node will return the sensor data requested.This process continues until all data has been received by the homenode. An example path shown in Figure 2 to retrieve ID 3’s data would be Home Node -> ID 1 -> ID 2 -> ID 3. The path would then return in opposite order, ID 3 -> ID 2 -> ID1 -> Home Node.
This path networking protocol was chosen because of its ability to be power efficient due to its speed and efficiency. Other protocols examined such as the CSMA/CA networking protocol. CSMA/CA is designed such that a node will wait until there is no traffic on a radio frequency then wait a random amount of time before transmitting its data. Once the data is transmitted, a node will wait for a period of time for an acknowledgement (ACK) from the receiving node. If the node times out and no ACK was received, it proceeds the same transmit protocol as above. The issue with CSMA/CA in this system is the potential of an exorbitant amount of transmitting from the operational nodes. This extra transmitting uses a great deal of power which can not be afforded in our system due to power and cost constraints.
Once all of the data has been collected by the home node, the home node will begin a sleep protocol. This sleep protocol is based off timing. The operational nodes will follow the same network protocol for receiving and transmitting data. This time, the command variable will be set to sleep, and the data will be set for how long the operational node should sleep. The cause an operational node to enter the sleep mode. Once all of the paths are sent by the home node, all of the operational nodes will be in sleep mode. Sleep mode will be attained by using the rocketscream library that shuts off the transceiver and other power hungry circuitry to save power. The operational node will wake up by utilizing the watchdog timer (WDT) to keep track of time and checking if the sleep time has been attained. The ATmega 328p has a internal watchdog timer (internal oscillator) that can be calibrated up to 1% accuracy. If nodes are waking up every 12 hours for a reading, this would result in a maximum drift of + 8 min. Because of this, the home node must wait a at least 8 min for all the nodes to wake up before requesting data from a node. We consider the homenodes clock as a point of reference since it has an accuracy of up to 1 sec every 30 years. When sleep mode is over, the node re-enters receive mode and takes a measurement while awaiting the next home node request.
|
Power & Monetary Savings
The operational node will be designed on a PCB to create power efficient, cheap, and easier to use system. By using an ATMega32p microcontroller, the operational node will have less hardware than an Arduino thus saving power. The sleep mode will also dramatically reduce the power used in the system. The power savings are described in more detail in the Power Testing. By moving the circuit to a PCB, the entire system decreases in cost to almost $11 as shown in Figure 3. |
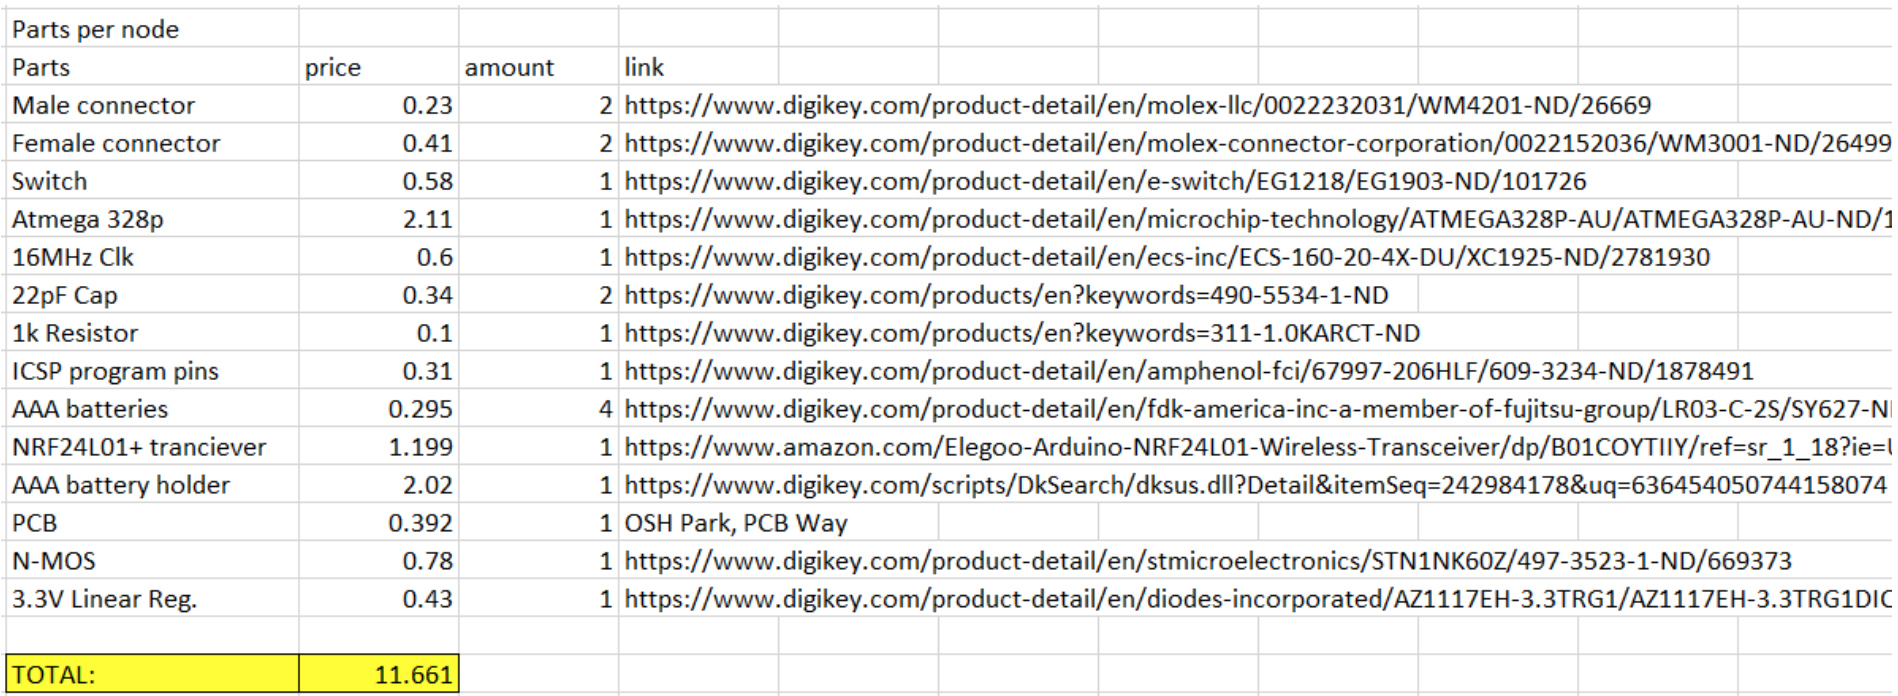
Figure 3: Operational Node PCB Cost
|
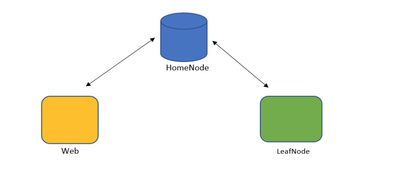
Figure 4: Role of the Home Node
Home Node
The home node is designed to retrieve a path from an api (web address). The retrieved path is an array of nodes that leads to the desired node as specified by the system’s shortest path calculation. The home node then relays the retrieved path to the sensor nodes. Also, the home sends out sleep and wake time to the operational nodes as well as receives the sensor data from them. It also post the data to the server so the user can access it. The home node has a bidirectional communication with the operational nodes and the web. The home node uses transceivers to establish bidirectional communication with the operational node. On the web app end, it uses HTTP POST and GET commands to establish communication. The HTTP POST and GET methods are achieved using a 2G module(sim900).
Once the path is retrieved, the home node will try to wake up the first operational node in the path and parse the path array to that node. After the transmission is complete, the home node starts a waiting loop for operational node response (receiving) with 5-second timeout. In the meantime, that operational node then determines its location in the path and continues to call upon the next operational node (see 4.1.1 Operational Node Design). This process will continue until the final node in the path has been called. The sensor data of the final operational node will be transmitted backward to the home node along the same operational nodes (in the path). The whole bidirectional communication event is expected to be performed within 5 seconds. Otherwise, the home node will break out of the waiting loop and return an empty data set.
After the data is collected by the home node, it is then processed into a JSON format and then uploaded to the web application over a 2G cellular network. This data is made available to the users over the webapp.
The web-server will return "a flag" value indicating the POST is successful. It will be checked by the home node again. If the flag returns success, the home node will send out sleep command to the op-node network and itself. All nodes will go to sleep thereafter in order to cut off power consumption. If not (flag returns no success), the home station continues to relay sensor data to the web until success.
Power Consumption
One of the main concern while attempting to design the power supply was power consumption. According to the datasheet, the SIM module requires a high current to power up. Hence, this module must be equipped with more robust batteries as it would require more power than the operational node. Since the goal of this project is building system out of easy to find, inexpensive parts, Li-on or Li-po battery with high capacity were selected to design a power supply. There were other solutions to this problem, and the solution we also came up with was using a Li-po battery with a solar-charging circuit. However, that should be considered as an alternative option because it was overpriced.
Web Application Design
For the web application, two different technologies were used to accomplish the needs of the project. First, a REST api was built using Spring Boot, so the home nodes could communicate with the database using HTTP requests. Spring Boot allowed the REST service to be compiled into a jar file that can be deployed on virtually any type of server that supports java (i.e. any linux or windows based server). The home nodes would send an HTTP request to the Spring Boot application containing node data, which then gets parsed, and stored in the database. Laravel, a PHP framework, was used for the user interface portion of the website. This front end application allows the system to deliver and populate web pages. These pages provide an interface to allow users to create accounts, claim home nodes, and view the data from those nodes. Between these two technologies is an SQL database that both services can access to store and retrieve relevant data.
The REST api (back end) offers a few key services. First, it allows the home nodes to send data to REST endpoints with a simple format. The home nodes are able to send JSON objects via POST requests to url endpoints. Second, it allows the web application to do much of the heavy lifting when calculating the shortest path between the home node and any given operational node. By using a Floyd Warshall algorithm, the application can calculate the shortest distance between any two nodes and use the resulting matrix to extract the shortest paths between the home and operational nodes. By doing this, the operational nodes are able to spend less time transmitting with a less efficient protocol. This allows the operational nodes to spend more time in the low power state, resulting in lower power consumption. All of this information is stored in the SQL database, and the paths to each node are retrieved via REST endpoints from the spring-boot application.
The user interface (front-end) provides a clean interface to add nodes and view their reports. The organization of data is fairly straightforward: A user can add home nodes, and underneath those they can add operational nodes. When they enter this information, they are prompted to provide GPS coordinates for each node (both types) that will inform the route calculation to be used when transmitting data. When nodes begin reporting, graphs are displayed for averaged data of all operational nodes for every home node that a user owns, as well as more specific data over time graphs if the user selects a particular operational node. The goal is to provide easy to look at data on the first page the user sees after logging in. All of this information is retrieved from the SQL database.
Non-functional
PCB layout and circuit schematic of the circuit for the operational nodes.
PCB layout and circuit schematic of the circuit for the operational nodes.
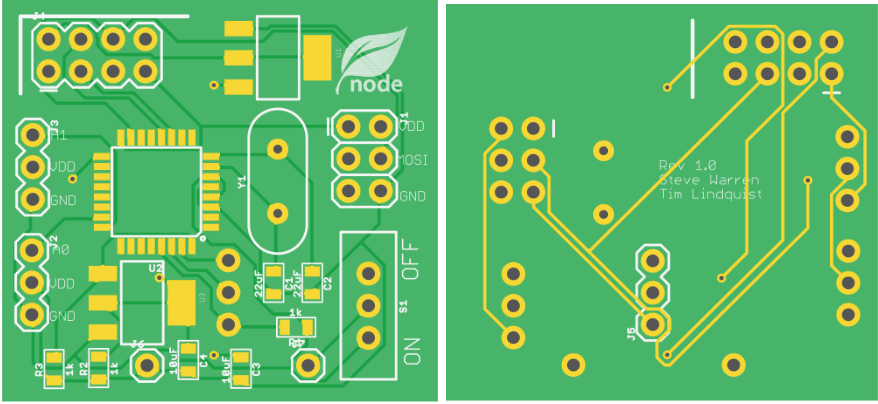
Figure 5: Operational Node PCB
|
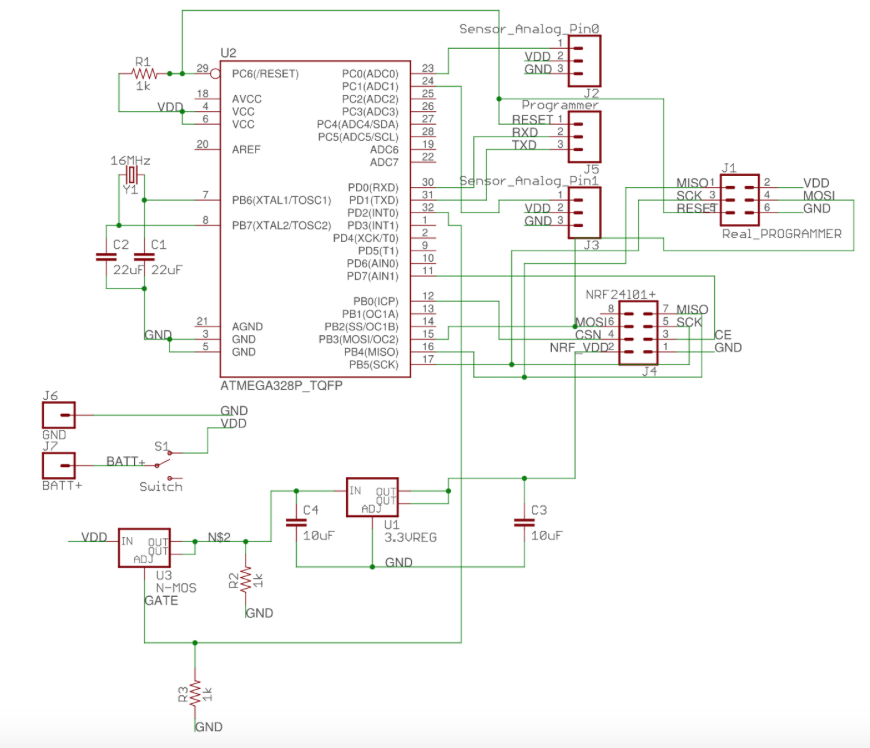
Figure 6: Operational Node Schematic
|
3D casing for the Home Node
The casing for the home node was designed using Autodesk fusion(A CAD tool). It then was printed out using a 3D printer.
The casing for the home node was designed using Autodesk fusion(A CAD tool). It then was printed out using a 3D printer.
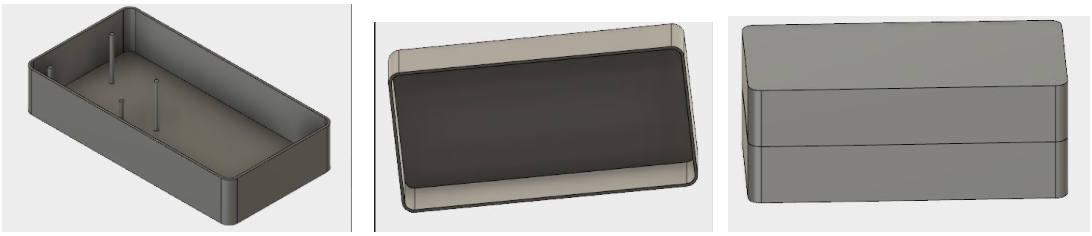
Figure 7: Home Node Case, made by Terver
Functional
This project does not currently possess any practices that would be considered unethical by organizations such as IEEE, ABET or others. The goal is to help society and more specifically farmers by increasing their crop yield with the information that they receive from the sensors. Standards can be beneficial so other students could pick up and continue the project. It also allows for the students currently working on the project to understand industry standards defined by IEEE and ABET.
- The system includes a home node with wireless capabilities to receive data and send it to a remote server.
- The system includes operational nodes with short range wireless capabilities to send data to the home node.
- The system includes a server to receive data from the home nodes.
- The system includes a web application to display the collected data to the user.
This project does not currently possess any practices that would be considered unethical by organizations such as IEEE, ABET or others. The goal is to help society and more specifically farmers by increasing their crop yield with the information that they receive from the sensors. Standards can be beneficial so other students could pick up and continue the project. It also allows for the students currently working on the project to understand industry standards defined by IEEE and ABET.
- The system follows the standard REST protocols (POST and GET) in the web application.
- The system follows javadoc in the implementation of the microcontroller for the Home node.
- The system follows I2C protocols for some of the hardware operations.
- The system runs on legal frequency ranges (2.4GHz for operational node).
Testing/Development
The testing and development of the project is described herein. The testing was divided into each of the three subgroups. This was done to ensure the hardware, software, and protocols were being tested to the specifications of the project and system.
Hardware/software
Below are the main components for the hardware and/or software used in the testing phase.
Software:
Postman: A program that can create web requests manually, and allows the team to verify that the application’s REST endpoints are working as intended.
JSONLint: Check the JSON format for the data layout sent from the home node.
JetBrains IntelliJ: A Java IDE developed by Jetbrains for Java development.
JetBrains PHPStorm: A PHP IDE developed by Jetbrains for PHP development.
Maven: Dependency management for java projects.
Jackson: A JSON deserializer to map JSON objects to Java objects.
JUnit: The Java unit test suite.
Hardware:
Arduino: The operational node group is using Arduinos to test receiving sensor data and transmitting/receiving data from the NRF24l01+. The Arduinos will be helpful for testing as they have the same microcontroller that will be used in the final revision of the operational node.
NRF24l01+ : These are small and inexpensive wireless modules that integrate well with Arduinos. The testing of these modules will assist in developing the wireless network so the Arduino will be capable of sharing its data.
2G module: provided by Geektech, this item is guaranteed to integrate well with Arduino. It includes the SIM900 module that supports most of US carriers and allows to send and receive GPRS data (TCP/IP and HTTP post) with AT command interface. This module will help establish a continuous connection between the home node and the server over the long distance.
Software Testing
The web application is currently running on a publicly accessible server, can receive data from the home nodes, and can display data for logged in users. While developing the REST for web service, the web team used Postman to send test data to the server, and make sure that the data was formatted correctly. Postman is a piece of software that allows the web team to mock REST calls by sending data directly, mimicking what the home-node would/should be sending. The user interface portion of the web application was built and tested using a local PHP server. By using a local development server, iteration can happen quickly when developing the user interface. Both the user interface and Spring Boot application used a locally hosted MySQL database during development. In addition to “functional testing”, JUnit tests were used to test the shortest path algorithm. Test data is provided, and the tests are able to verify that the algorithm is performing as expected.
|
Operational Node Range Testing
To test the range of the transceiver, Tim built a program that checks the number of correctly received packages and displays the data as a signal strength percentage. 500 data points are collected and stored in an array, if a package is correct, that array index is 1 and if it is incorrect or missing the array index receives a 0. After which a continual averaging system sums the entire array and divides by 5 to get a number between 0 and 100 corresponding to percentage. The array is incremented and reset upon overflow. A size of 500 was chosen to create a large enough window for some stability during the discrete time averaging. The program finally outputs the percentage value to be displayed over serial interface. |
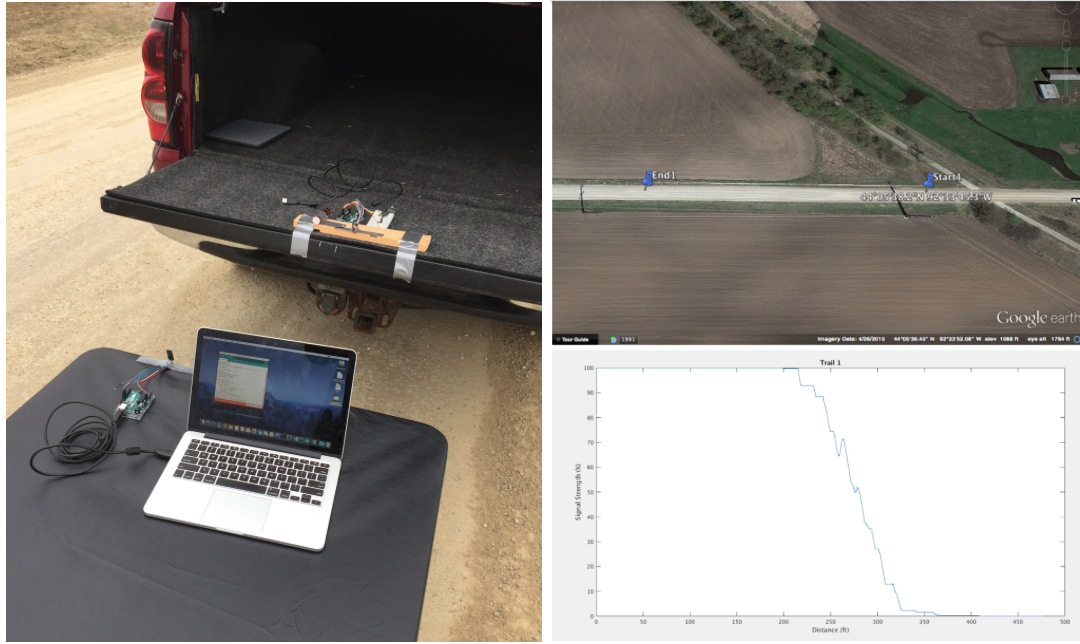
Figure 8: NRF24L01 Range Test
|
Testing was done by going to a rural road in an open area. The transmitter was attached to the gate of the truck and the receiver was mounted on a stationary table in the road. The initial starting point was recorded using GPS coordinates. Communication with the driver was done over cell phone. The test began by plugging in the transmitter and starting the serial logging of the signal strength data. At that point the truck drove forward at a constant 10 mph. When the data zeroed out, I signaled the driver to stop as well as stopping the data log. The end point was recorded using GPS coordinates. A graph was constructed of the signal strength vs distance by determining the distance between the two points and then mapping the incremented values to the data points.
Average plot of the trials showed that transceiver has a reliable distance up to 200ft. After this, the signal strength drops off steeply. The stronger wireless transceiver exceeds this distance but was not used for testing because they are more expensive modules to buy with unreliable suppliers. These sensors are to be placed one per acre.
Average plot of the trials showed that transceiver has a reliable distance up to 200ft. After this, the signal strength drops off steeply. The stronger wireless transceiver exceeds this distance but was not used for testing because they are more expensive modules to buy with unreliable suppliers. These sensors are to be placed one per acre.
|
Operational Node Power Analysis
Figure 9 shows the power characteristics for the a operational node. For power testing of the nodes the operational node team went through the datasheets for the power consumption of the main components. It was found that the transceiver consumed the most power and because of this, the team wanted to use it as little as possible. The calculations above show the total power by breaking each component up into its dynamic and static power consumption components. From this the team found the amount of time each component would be on during a day and then calculated the amount of energy used in a day. From that data, the team derived the total power to be 2.98mW. Because the team knows the capacity of the batteries, the team is able to estimate how long they would last with this power requirement. It was found that if 3 AAA cell batteries were used, the user will get approximately 7 months of life from a node. This covers the growing season for farmers which allows this to be a viable option. |
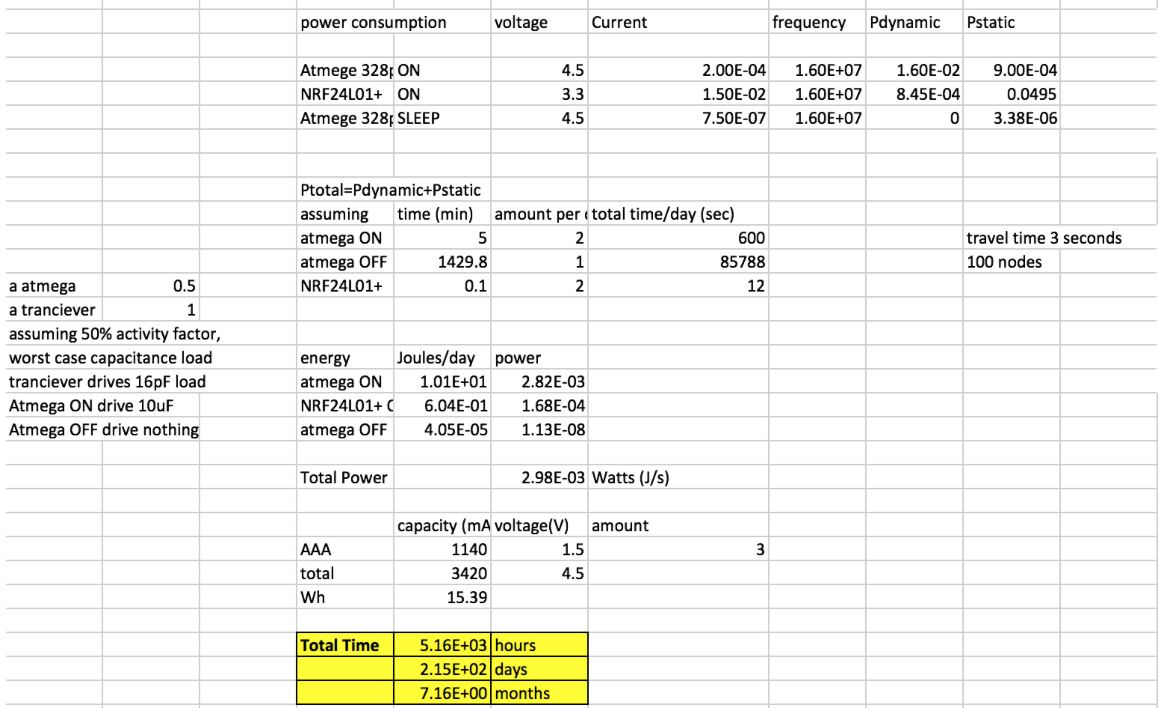
Figure 9: Power Characteristics
|
Operational Node Network Testing
Testing to see if the operational nodes work was done by setting up a network around Coover Hall. In this test the first and last node were out of range of each other and thus needed to communicate through a middle node to reach. This test had 4 nodes that did a loop around coover. The operational node team built a program to mimic the home node to call out and receive the nodes data since their part was not completed at the time of the test. This proved to be successful by relaying the correct sensor data through the network for each node called. From this the operational node team was able to conclude the network algorithm works correctly.
Testing to see if the operational nodes work was done by setting up a network around Coover Hall. In this test the first and last node were out of range of each other and thus needed to communicate through a middle node to reach. This test had 4 nodes that did a loop around coover. The operational node team built a program to mimic the home node to call out and receive the nodes data since their part was not completed at the time of the test. This proved to be successful by relaying the correct sensor data through the network for each node called. From this the operational node team was able to conclude the network algorithm works correctly.
|
Operational Node Sensor Solution Testing
Commercial moisture sensors come in a wide range of prices and measurement techniques. The sensor in figure 16 is a resistive gypsum sensor bought for $40. For being a block of gypsum with 2 electrodes inserted this price is incredibly steep. Tim set out to design a potential low cost sensor for our group shown in the efforts below. This testing was done on a material provided by the ABE department. The figure above shows the effects of the samples capacitance in a dry and 25% moisture environment. From the initial results you can see the group of lines above represent 25% moisture and the group below dry. This shows that the materials capacitance increases by over 2 orders of magnitude when it is introduced to a 25% moisture environment. In figure 18 shows the resistive gypsum sensor Tim developed. It is comprised of a PCB of meshed fingers to increase surface area of the border between separated plates to decrease resistance. On top a slurry mixture of crushed gypsum mixed with a adhesive to form the variable resistor. On the right shows an initial test of the sensors resistance readings. At time 0.1 hour the sensor is placed in a 25% soil moisture environment. Readings stabilized at an hour and the sensor was moved to a dry environment. The last of the readings show it returning to the dry resistance level over the course of a few days. |
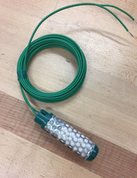
Figure 16: Commercial Sensor
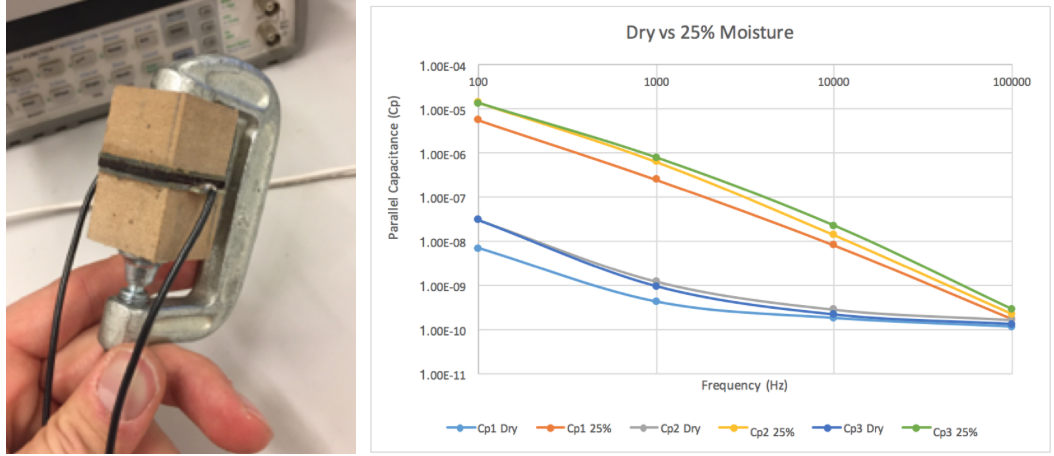
Figure 17: Capacitive Sensor Prototype
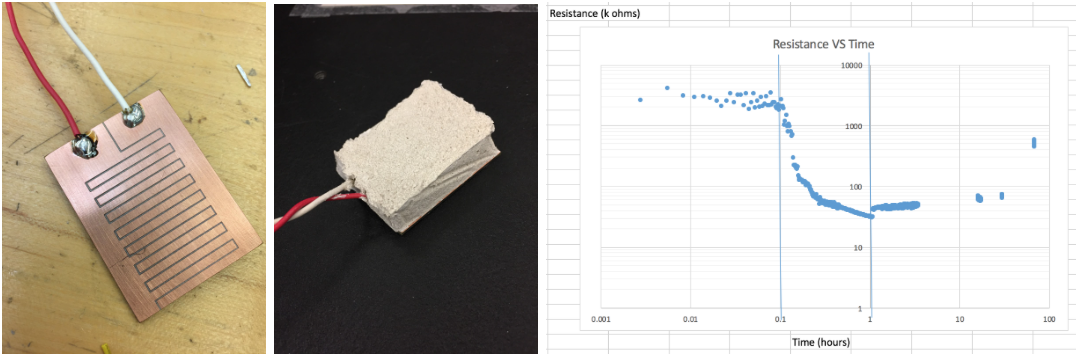
Figure 18: Resistive Sensor Prototype
|
Home Node Testing
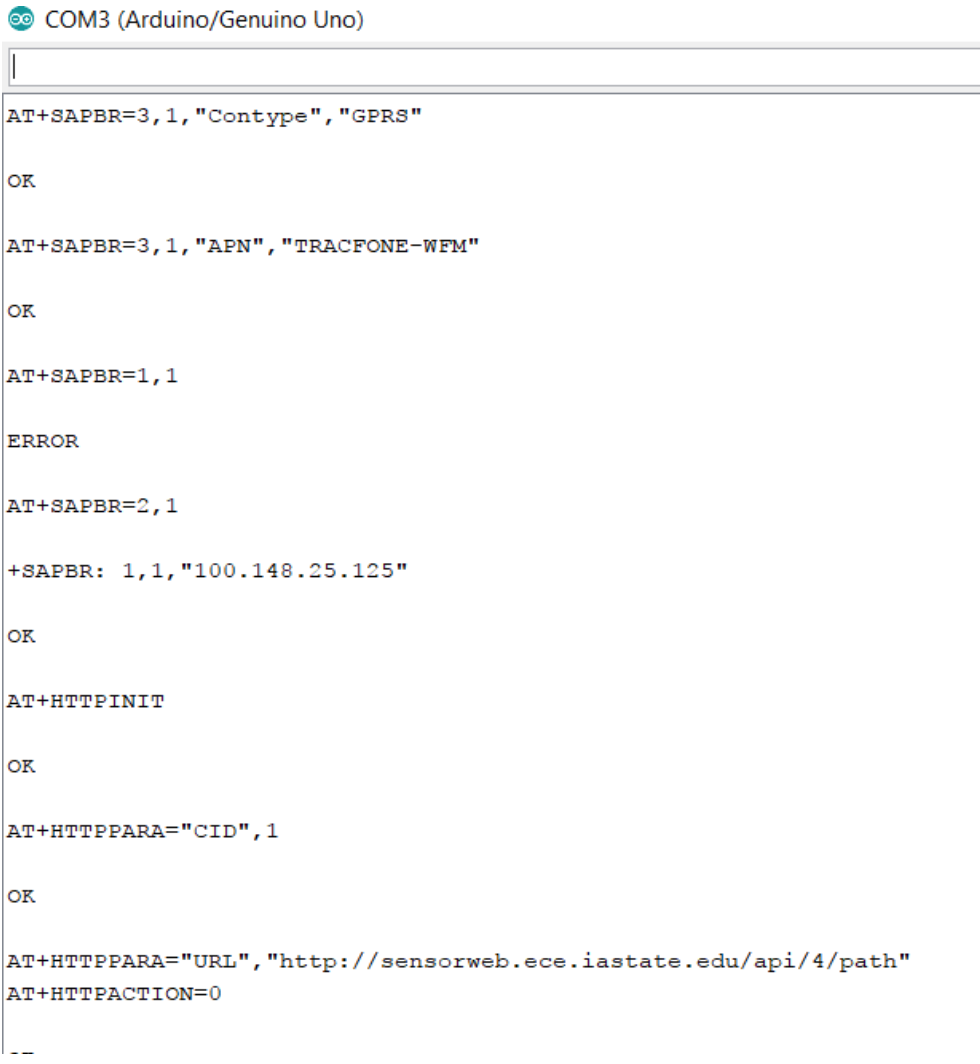
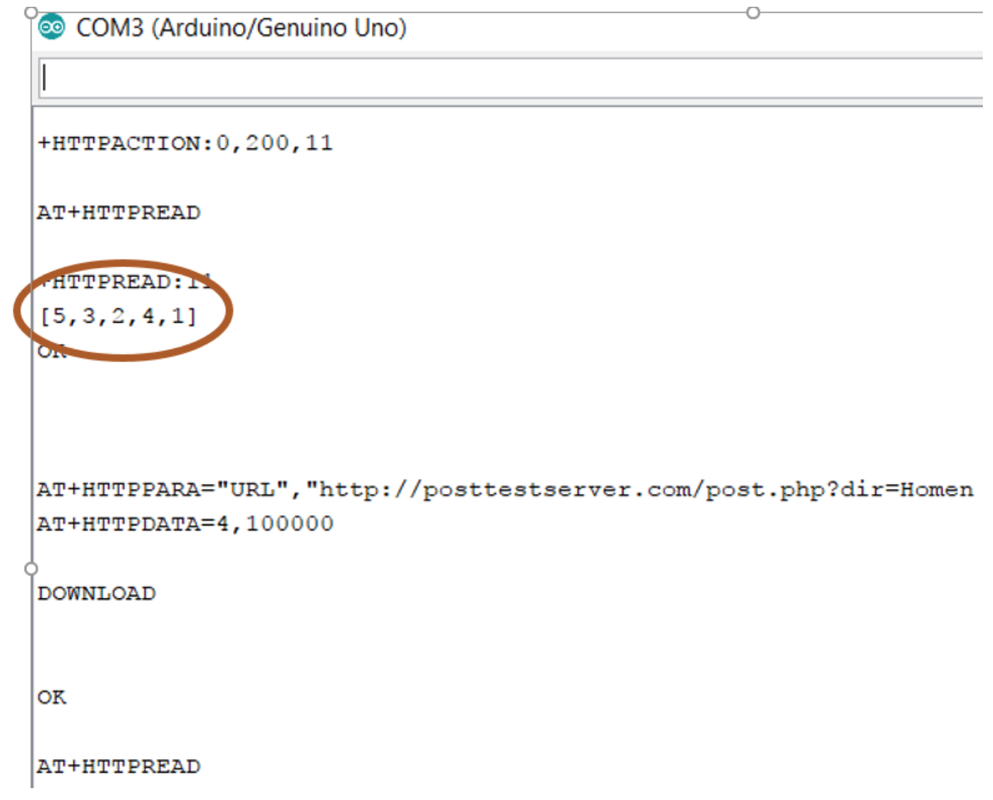
The Home node testing was divided into two parts. The fist part was communication with the web app and the second part was communication with the operational nodes. For web app communication, the homenode was tested by sending out a GET command to a server. The home node (HTTP functionality) was initialized using AT commands and then the reply from the API(web app) was displayed on the Arduino serial monitor. The reply contained the path to the desired node. The home node then extracted the path from the reply using loops and then put it in an array(path) in a struct which was then sent to the operational nodes . For operational node communication, the operational nodes were simulated using an Arduino equipped with a transceiver. The simulated home node (which had the 2G module and transceiver) was made to receive(path from api) and then transmit the desired data(path) to the simulated operational node. The home node after transmission, switched from transmitting mode (transmitting path) to receive mode(to receive sensor data). The home node extracted the sensor data from the received struct and converted the data into a JSON format string. This string was printed to the serial monitor to ensure its accuracy. The data (in JSON format) was then posted to a test server (posttestserver) using POST command. Each of the procedures mentioned above(web communication and operational node communication) were tested separately and then were combined and tested as a unit. For debugging purposes, a serial monitor was used to display the result. The serial monitor output is shown on the next page
The Home node testing was divided into two parts. The fist part was communication with the web app and the second part was communication with the operational nodes. For web app communication, the homenode was tested by sending out a GET command to a server. The home node (HTTP functionality) was initialized using AT commands and then the reply from the API(web app) was displayed on the Arduino serial monitor. The reply contained the path to the desired node. The home node then extracted the path from the reply using loops and then put it in an array(path) in a struct which was then sent to the operational nodes . For operational node communication, the operational nodes were simulated using an Arduino equipped with a transceiver. The simulated home node (which had the 2G module and transceiver) was made to receive(path from api) and then transmit the desired data(path) to the simulated operational node. The home node after transmission, switched from transmitting mode (transmitting path) to receive mode(to receive sensor data). The home node extracted the sensor data from the received struct and converted the data into a JSON format string. This string was printed to the serial monitor to ensure its accuracy. The data (in JSON format) was then posted to a test server (posttestserver) using POST command. Each of the procedures mentioned above(web communication and operational node communication) were tested separately and then were combined and tested as a unit. For debugging purposes, a serial monitor was used to display the result. The serial monitor output is shown on the next page
|
Home Node Power Analysis / Cost
As shown in the power analysis data, for testing purposes, the home node is using the Lipo battery which can last for 1 week 5 days if the home node is active for thirty mins a day. However, in order for the home node to have energy supply throughout the duration of the planting season, it would need to be equipped with a battery that has the rating of at least 7980mAh (preferably slightly higher) and a voltage supply of 5 to 12V. Although we did not try to reduce the current requirement of the home node since it was not the aim of the project and the time constraint was not favourable, we were able to note that using a home node specific controller would significantly reduce the current requirement. Apart from energy cost, the components cost was also analysed as shown in the figure above. The components all together cost $42. This cost does not include that of obtaining a sim card and data plan. |
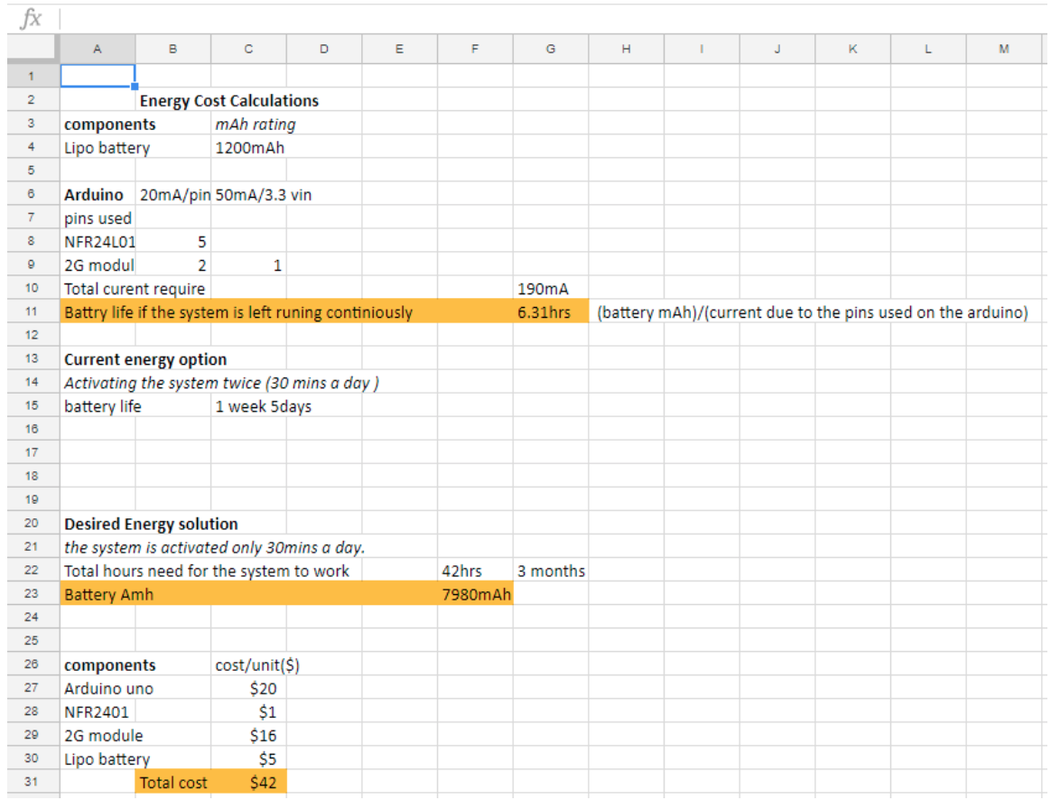
Figure 19: Home Node Analysis
|
Results
Home Node Testing Results
The group tested the 3G module to ensure proper communication with the Arduino (microcontroller) and that it was able to post and request the web application. Initially, the Arduino was unable to read data from the 3G module (SIM5320). It was believed that the Adafruit library didn’t fully support all AT commands of the module, which caused the failure of network initialization. Several different modules were used for testing to determine the feasible hardware for the purpose of this project. Eventually, a SIM900 module was selected because it came with fully supported AT command library. With sim900(which is a 2G module), the group was able to read data from the api provided by the software group; also to post data to a test server(posttestserver). Moreover, the network coverage of 2G is is superior to that of 3G or LTE. With 2G, the better reception can be achieved even in a remote rural cornfield where 3G is out of service. And most 2G module is also cheaper than 3G ones. Therefore, sim900 was able to meet all the requirements needed for the project in term of technical support, network coverage, and price.
Operational Node Testing Results
The range testing proved to work as expected and covers the range of our intended application. The power analysis also proved to be successful as the node should last 7 months, which should be long enough to work during a farmer’s intended season. The node network test was also successful and the network can be scaled up to a much larger size.
Web Testing Results
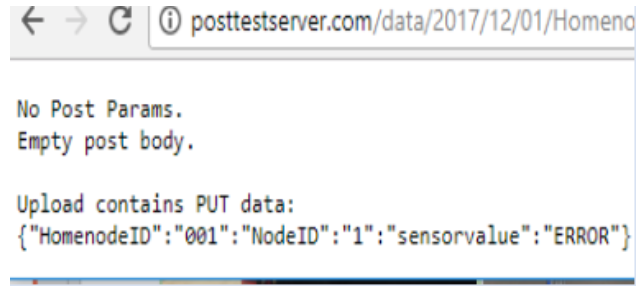
In the web testing, data is sent to the web site (Sensor Web) and the data sent has to be in JSON format. In the testing procedure, a JSON format data and a data which is not in JSON format is sent to the web to verify if the web can detect the format type. The web is able to detect the format of the sent data. Web testing results can be seen below in figure 13 . This quick and dirty interface allowed the home-node team to send data to the web application and verify that they were sending it correctly. The process was later refined to verify that the de-serialization process was happening correctly, instead of just verifying that the string was valid JSON.
Home Node Testing Results
The group tested the 3G module to ensure proper communication with the Arduino (microcontroller) and that it was able to post and request the web application. Initially, the Arduino was unable to read data from the 3G module (SIM5320). It was believed that the Adafruit library didn’t fully support all AT commands of the module, which caused the failure of network initialization. Several different modules were used for testing to determine the feasible hardware for the purpose of this project. Eventually, a SIM900 module was selected because it came with fully supported AT command library. With sim900(which is a 2G module), the group was able to read data from the api provided by the software group; also to post data to a test server(posttestserver). Moreover, the network coverage of 2G is is superior to that of 3G or LTE. With 2G, the better reception can be achieved even in a remote rural cornfield where 3G is out of service. And most 2G module is also cheaper than 3G ones. Therefore, sim900 was able to meet all the requirements needed for the project in term of technical support, network coverage, and price.
Operational Node Testing Results
The range testing proved to work as expected and covers the range of our intended application. The power analysis also proved to be successful as the node should last 7 months, which should be long enough to work during a farmer’s intended season. The node network test was also successful and the network can be scaled up to a much larger size.
Web Testing Results
In the web testing, data is sent to the web site (Sensor Web) and the data sent has to be in JSON format. In the testing procedure, a JSON format data and a data which is not in JSON format is sent to the web to verify if the web can detect the format type. The web is able to detect the format of the sent data. Web testing results can be seen below in figure 13 . This quick and dirty interface allowed the home-node team to send data to the web application and verify that they were sending it correctly. The process was later refined to verify that the de-serialization process was happening correctly, instead of just verifying that the string was valid JSON.
Conclusion
The first hardware group (Operational Node) determined what sort of communication would be best between the operational nodes and the home node. From there, they had to decide on which hardware satisfied their needs of low power and inexpensive. In the end, the team decided on an ATmega microcontroller with an attachable transceiver. The NRF transceiver was chosen, because the it met the distance requirement was reliable and are incredibly cheap. The node modules are easy to produce, and manipulate, which makes sending and receiving data simple. They developed a PCB that would work as their operational nodes and software to have their operational nodes operate in the network configuration. The operational node is a success, it is under cost, transmits in a network configuration, and meets power constraints.
The second hardware group (Home node) uses an arduino as a controller and a 2G module to send sensor data to a remote server and receive path to a specified node from an api provided by the web team . This is conveniently done by converting the data to JSON string format before posting it. The 2G module offered a more reliable AT command and a robust arduino library therefore, it is an easy choice for our purpose. Apart from the reliability of the module, using it alleviates the worry of not having WiFi or Ethernet in the field since the module relies directly on cellular data. Other than communicating with the web app, the home node also communicates with the operational node. it achieves this by using a transceiver to send path and receive sensor data from the operational nodes. it also sends the nodes a sleep and wake time. The nfr24l01 transceiver was used for this purpose. The use of this transceiver removed the concerns of compactability with the operational node since the operational nodes uses the same transceiver. Also, the transceiver has a robust arduino library and it is relatively cheap compared to other means of radio communication that would have served this purpose. The home node meets all its requirement of operation. however, the price can be reduced if an arduino clone is used as a controller and a 2G shield is built from scratch.
The Web Application team ended with a system that used Spring Boot to create REST endpoints, and a PHP application that would deliver web pages. It is not uncommon in industry to have two separate applications for front and back end, and it allowed the members of the team to work with technology they specialize in. We were able to use JUnit to prove that our shortest path algorithm worked, and the Home Node team verified that they were able to GET paths from our REST endpoints, as well as POST sensor data. Our front end can be viewed as expected from the domain provided to us by ETG, with information pulled from our database.
At the outset of this project, the team’s goal was always to create proof of concept. The team believes that this has been accomplished. The team has delivered a cost efficient operational node, a prototype for a home node that has internet access, and a web application that can recieve and organize the information from the home nodes.

Second Place Winning Team
|
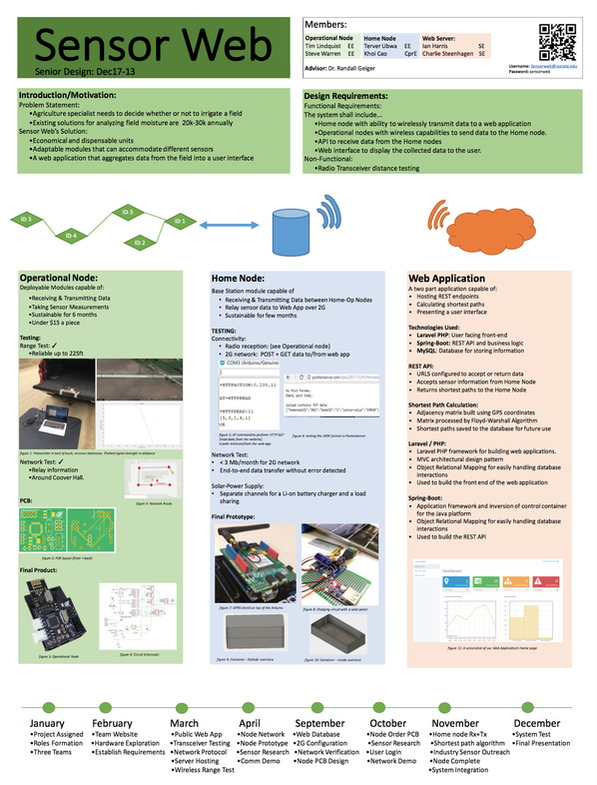
Poster
|
References
[1] Miner, Andrew. "Networks 2." Lecture.
[2] Tuttle, Gary, Barebones Arduino.Print
[3] TempuTech, "Wireless Sensor Monitoring," TempuTech, [Online]. Available: http://www.temputech.com/26-home/slider/113-wireless-sensor-monitoring. [Accessed 21 02 2017].
[4] Banner Engineering Corp. "Wireless I/O & Data Radios | Products for Industrial & Process Automation." Banner Engineering. Banner Engineering, n.d. Web. 21 Feb. 2017.
[5]unknown, "eba," eba, 2016. [Online]. Available: http://www.educational-business-articles.com/5-step-problem-solving/. [Accessed 21 02 2017].
[6] Kolita-Forbes, Amy. Soil Testing Interview. 3 March 2017.
[7] Behrens, Jake. Biodegradable 3D Printing Information Session. 23 February 2017.
[8]“Aqspy Demo.” Login, Aqspy, 30 Nov. 2017, demo.agspy.aquaspy.com/.
[9] “Login.” FieldConnect, John Deere, 30 Nov. 2017, login.fieldconnect.deere.com/login.
[10] Vellidis, George. “Vellidis Research Group – A dynamic blend of engineers and scientists.” Vellidis Research Group, 2017, vellidis.org/.
[11] Moon, Youngbag. “Sensor Data Management System in Sensor Network for Low Power.” IEEE Xplore Library, IEEE, 17 Feb. 2008, ieeexplore.ieee.org/document/4493812/.
[12] Cardell-Oliver, Rachel. “A Reactive Soil Moisture Sensor Network: Design and Field Evaluation.” International Journal of Distributed Sensor Networks, Sage Journals, 1 Mar. 2005, journals.sagepub.com/doi/abs/10.1080/15501320590966422.
Appendices
Operation Manual
The following is a description of how to operate each subgroup’s module.
Operational Node
The following procedure will discuss how to set up the operational nodes:
Materials needed:
Laptop, GPS, Shovel, Node, Batteries, Marking Flag
Procedure:
Determine a location in your field to place your nodes. Keep in mind the distance requirement that separation must be less than 1 acre for functionality. After that, go to the location where you would like to place a node. Using a GPS record the coordinates of the node and the given ID you are providing it in a spreadsheet.
Next it is time to flash the software on the node. First switch the node to the OFF state so that potential differences won't affect programing. Connect the ICSP connector head to the node and plug the serial programmer into the laptop's USB port. Alter the code to have to correct node ID and perform a serial program to load the code onto the chip. After this time unplug the ICSP programmer from the node and insert 3 AAA batteries into the module.
Now it is time to attach the moisture sensor. Use a shovel dig a hole at the correct depth for your analog moisture sensor. Place it in the hole with wire leads coming out and burry the sensor. Now connect the instrument to the nodes analog port A0.
Lastly, flip the switch to the ON position to turn on the node and begin the program. place the node on the ground with the transceiver upright. Place a marker flag near the node to visually represent its location. The node will now sit in listening mode until the next call period by the home node. Once updated into the database with the laptop recorded information when called upon it will enter the loop and become part of the network.
Home Node
In this part, the Home node setup procedure:
materials needed:
2G module(GeekTech 2G shield), arduino, transceiver, jumper wires( male and female), battery, laptop.
In the home node setup, arduino programming knowledge is required. A basic understanding of AT commands is a big plus since they are used to program the module. However, AT command look up sheets are available online for reference. ( make sure the AT command sheet you are looking up is compatible with your module).
In the final prototype,
Procedure:
Place the 2G shield on the arduino such that pin 7 and 8 are the receive and transmit pins of the arduino uno(the shield is designed to fit perfectly so do not force it on to the arduino). Use jumper (male and female) wires to connect the transceiver to the arduino(make sure to avoid 2G shield reserved arduino pins by reading the shields data sheet). Power up the arduino. In order to conserve energy, the home node system uses a solar charged battery to provide power to the arduino and subsequently to the transceiver and the 2G module. Compile the home node code and upload the code to the arduino. For the system to work as designed, it has to be within talking distance with the operational nodes as specified in the transceiver datasheet. The home node would post an ERROR in place of sensor value to the web app if operational node is not reached.
Web Application
Materials Needed:
A web browser, a linux server
Disclaimer:
The web application should not be hosted by the user, but instead would be provided by a 3rd party provider (our team in this case). The high-level deployment strategy will be discussed, but the user is not expected to have to perform any of these tasks.
Spring Boot App Deployment:
Code for our spring boot application can be found on github (see section 9.4.3). This is a Maven project, and should be imported to a Maven compatible IDE such as Eclipse or IntelliJ. The project is configured such that a `maven spring-boot:repackage` command will build the project as a Jar. From there, the application should be deployed on the linux server, or other machine. For a linux server, this can be accomplished by using `java -jar name_of_jar.jar`. Ideally, this command will be run as a service, but that won’t be covered here. Spring-Boot runs as an Apache Tomcat server, and will require port 80 to be accessible, a domain name to be configured, and not have any other services binding to port 80. The port may be edited in the project’s application.properties, but will only be available via HTTP if port 80 is chosen.
PHP Application Deployment:
Code for the PHP application can also be found on github. This project is a Laravel application, which is a PHP framework that gives us the ability to manipulate object-relational mapping to maintain the database and the MVC architectural pattern to handle routing, views, and data processing. Since this project was version controlled using Git, to deploy the latest version of the project all that is required, is a pull from the master branch onto the live server.
MySQL Deployment:
Our project was built using a MySQL database which requires a MySQL server running on a linux server. To handle database updates and changes, we use the MySQL command line to dump our local database changes, and then use the dumped file to inject those changes into our live database.
Alternative / Other Initial Versions
Other versions of the operational node network protocol was developed earlier in the first semester. This network design was designed such that every node would send out the new information and then not send that information again unless it had the return flag set to high. This had many issues including not working if there were any transmission collisions. Data Packets could easily become corrupted if two operational nodes happened to receive the information at the same time and transmitted at the same time. These collisions were not experienced in testing but were recognized as a possible problem. To overcome this issue, the new node network protocol was designed as discussed earlier in this report.
Other Considerations
The operational node group also considered using XBee technology. This was quickly disregarded as this would not reach the price goal of this project as XBee technology can cost ~$40 per XBee while the radio technology this project uses is ~$1 per radio.
Code
The code for the following subgroups is shown below.
Operational Node Code: https://github.com/timlindquist/Sensor-Nodes
Home Node Code: https://github.com/Kacao9x/491_IoT_monitor/tree/master/Home-Node
Web Application Code: https://github.com/csteamengine/sensorweb
Independent Assessment
To gain feedback on our working system we reached out on faculty and industry experts. The first was Dr. Amy Kaleita-Forbes whos is a Associate Professor in Agriculture and Biosystems Engineering. She provided system and website suggestions on different types of plots useful to soil moisture analysis. Dr. Kaleita-Forbes was especially helpful with her input of how to obtain different moisture levels in soil, this was used throughout prototype sensor testing.
Next Tim reached out to Dan Bredbeck an applications engineer at Certainteed Gypsum. Dan gave advice and suggestions for how to go about getting gypsum onto a PCB substrate. He came up with growing a crystal or a slurry solution.
Lastly Steve, Tim and Dr. Geiger sat down with Dr. Sally Logsdon a soil scientist at the National Laboratory for Agriculture and the Environment to discuss our solution. Dr. Logsdon informed us of the optimal depth of burying the soil sensors: 5 cm, because it is a good representation of surface moisture content and can be used to model deeper depths. She also brought up a concern of mice and lightning ruining our operational nodes and sensor cables. We didn’t think lightning would be a concern since our operational nodes a low to the ground, however mice may be a concern. Because of this, precautions, such as a silicone coating, will be used to shield the devices. The last thing we discussed was people's sensitivity towards pollution. We would like to leave our sensors out in the field and not have to worry about clean up when they die. This would save money as most of the solution cost is in labor. We could automate the system by placing an auger on a tractor to drop the modules at preset location and not have to worry about later capture. Dr. Logsdon did not think this would be an issue as the operational nodes were tiny.
